Most of us did not enjoy math as part of our childhood studies.
Maybe your teacher mentioned words such as “parabola” and “logarithm.” Or perhaps your textbook opened to reveal pages full of numbers, symbols and graphs that seemed more alien than useful.
But here’s the thing: math wasn’t impossible – we just couldn’t see it clearly enough to grasp its implications.
From Frustration to Freedom: Why Visual Math Matters
Scientific graphing calculators are game changers for modern learners.
Let’s be honest–most people struggle with numbers at first glance, as it can be hard to connect abstract concepts like growth curves or negative slopes when all they see are dull digits strewn across a page. Visual math offers us hope! By giving people access to numbers as images on paper and through other mediums, many more will appreciate its power in unlocking creative math concepts like graphing the relationship between one number and another in meaningful ways.
But when math becomes visible, its meaning changes dramatically; like turning on a light in a dimly-lit room.
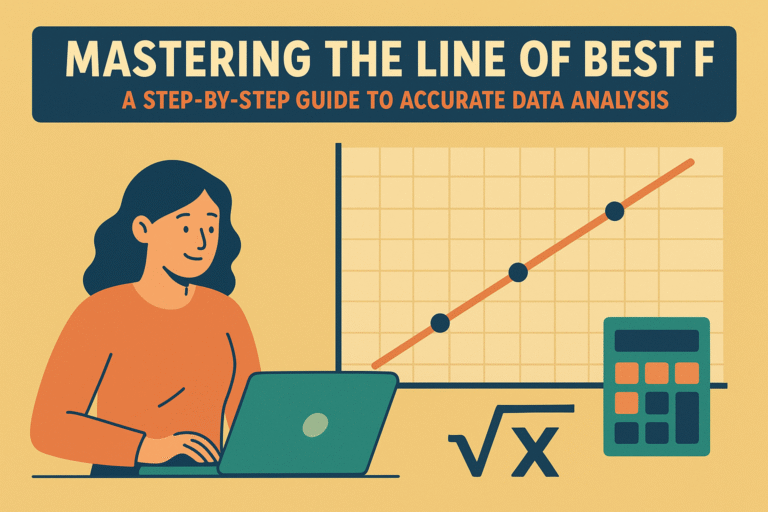
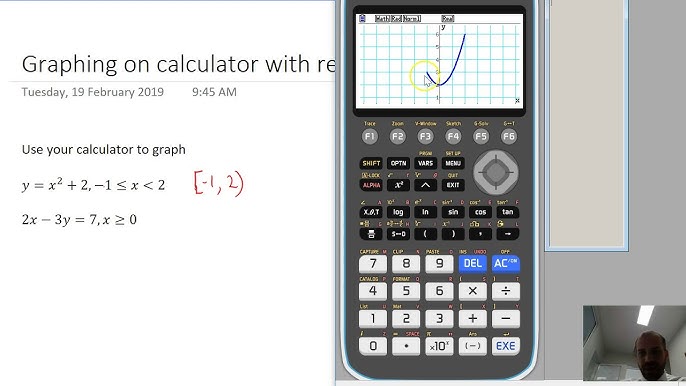
A graphing calculator doesn’t just tell you an answer–it shows you. That’s what sets it apart; that’s the bridge between confusion and clarity. With just a swipe or click, suddenly, you’re watching how a curve morphs, points move around or how even slight modifications create entirely different narratives.
Real Story: Maya Discovers She Can Do Math
As a college freshman majoring in marketing, Maya never thought she was cut out for math. Although she passed algebra classes with difficulty, feeling as though the subject just wasn’t meant for her mind – things changed during her first semester of statistics when her professor introduced an online scientific calculator with graphing capabilities – suddenly Maya became someone who loved numbers!
Instead of spending her days solving tedious problem sets on paper, she was encouraged to plot scenarios on-screen instead. Zooming in and comparing outcomes were among her many abilities that allowed her to see relationships between various scenarios more readily.
Maya began staying after class not just to catch up but because she was truly intrigued. Math wasn’t simply another requirement–it became an intriguing puzzle that unraveled into patterns, pictures and Maya became fascinated.
Why This Tool Is More Than Just a Calculator
Let’s be clear–today’s scientific graphing calculators have come a long way since their school days. They now incorporate advanced features that make their use far less cumbersome and clumsy than ever.
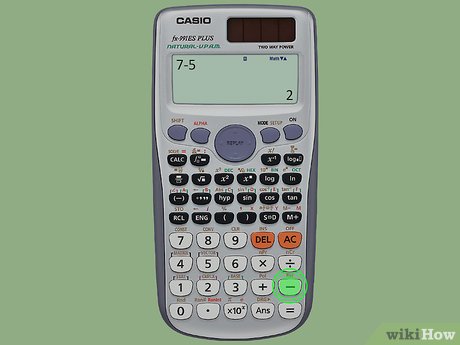
No matter if it’s a sleek handheld device or an intelligent online scientific calculator that works through your browser, these tools are not simply designed to compute but to also teach.
With just a few taps, you can explore how one variable influences another; or track if a change affects both variables simultaneously.
Watch as patterns form before your very eyes!
Compare two completely distinct concepts within one frame
Your own math teacher! Never tires of answering all your queries!
But here’s the beauty: no need for techie know-how when using them! The top scientific calculator online options are intuitive enough that even people unfamiliar with math can use them easily; all you have to do is speak it fluently – they translate for you!
Math in Motion: Why Graphing Makes a Difference
Imagine trying to describe a rollercoaster ride to someone who’s never experienced one before.
Your sentence could sound something like this: It goes up slowly, then drops quickly before looping around to level out at the bottom.”
Or…why don’t you show them a video instead? No contest here?
Graphing calculators make math much more tangible by showing its various mathematical expressions through graphics. Instead of simply telling you “This number grows exponentially”, they display its graph as it becomes steeper and steeper; and instead of saying, “This equation has two solutions”, they pinpoint where exactly these solutions intersect the line on which its graph has touched.
Math shouldn’t just be about simplifying, it should make sense!
Say Hello to Online Experience
Today, leveraging this power is more accessible than ever: With just a quick Google search you can locate the ideal scientific calculator online right on your phone, tablet or computer!
These interactive, modern online tools offer much greater flexibility than their physical equivalents. Some even let you drag points, draw custom graphs or even animate real-world data!
These programs come equipped with all of the bells and whistles: visual history, graph overlays, problem-solving steps, guidance for understanding complex concepts and even built-in guidance for when students become stuck on difficult concepts.
Learning doesn’t need to stop when the classroom doors close.
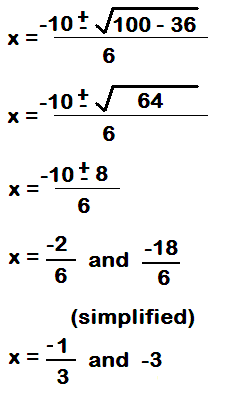
Let’s discuss a feature that’s been indispensable: Quadratic Formula Calculator.
Let’s forgo the traditional formulae here and focus instead on how this feature has helped one real student named Josh.
Josh was struggling to prepare for his final math exam. He found himself stuck on a complex problem involving curves and points of intersection he hadn’t quite understood before, which required curves with curves intersecting at points of intersection. Instead of guessing or giving up, Josh opened an online tool equipped with quadratic helper features to assist.
Within moments, he had access to a graph in which he could zoom in, edit numbers and finally understand why the curve deviated in that way – something no textbook ever offers him.
Josh found the Quadratic Formula Calculator more than just convenient–it was instrumental in his understanding of this complex subject matter.
Think tech is just for school?
Think again. These devices provide lifelong learning companions.
Graphing calculators are used by engineers designing bridges, economists analyzing financial trends, biologists studying growth rates and architects creating scalable plans.
Small business owners rely heavily on online scientific calculators for monitoring inventory trends or forecasting seasonal shifts.
When you can visualize numbers, making smarter decisions becomes much simpler–whether budgeting home expenses or creating a product line.
Visual Math Is Here to Stay
We live in a visual-first society.
Instagram, TikTok and YouTube thrive because they allow ideas to materialize into something tangible for us all to see.
Math has finally caught up.
Graphing calculators are part of an overall shift in our learning methods: less memorization and more hands-on exploration, with greater curiosity than fear, more discoveries than frustrations.
As education moves toward hybrid and online learning environments, having an interactive scientific calculator that matches its dynamic experience just makes sense.
What to Look for in an Online Scientific Calculator
When exploring options, here’s what distinguishes great scientific calculators:
Graphing Capabilities – Your graphing abilities must allow for effortless plotting, zooming and interrogation of visual data.
Real-Time Feedback – Instant visual feedback as you input or modify values.
User-Friendly Design – Enjoy a clean layout, clear instructions, mobile-friendly access and mobile accessibility.
Built-In Support Tools – such as the Quadratic Formula Calculator for complex topics.
Free Access – Accessing quality education should not have any financial barriers associated with it.
No downloads. No accounts. Just open, explore, and discover.
Final Thoughts: An Aid That Increases Confidence
It’s true: most people aren’t “bad at math.” Instead, they just lack access to proper tools.
Scientific graphing calculators – particularly online versions–are changing this narrative. Not only do these tools enable you to get to your answer faster and understand why it is correct, they also teach you why this answer exists in the first place.
Computer games offer visual learning experiences that excite curiosity while building confidence in young learners.
No matter if you are a student, parent, professional–or someone who always thought math was just out of reach–now is the time to give math another try!
But not with pencil and paper.
But with an effective tool that lets you visualize the meaning behind the numbers.

